

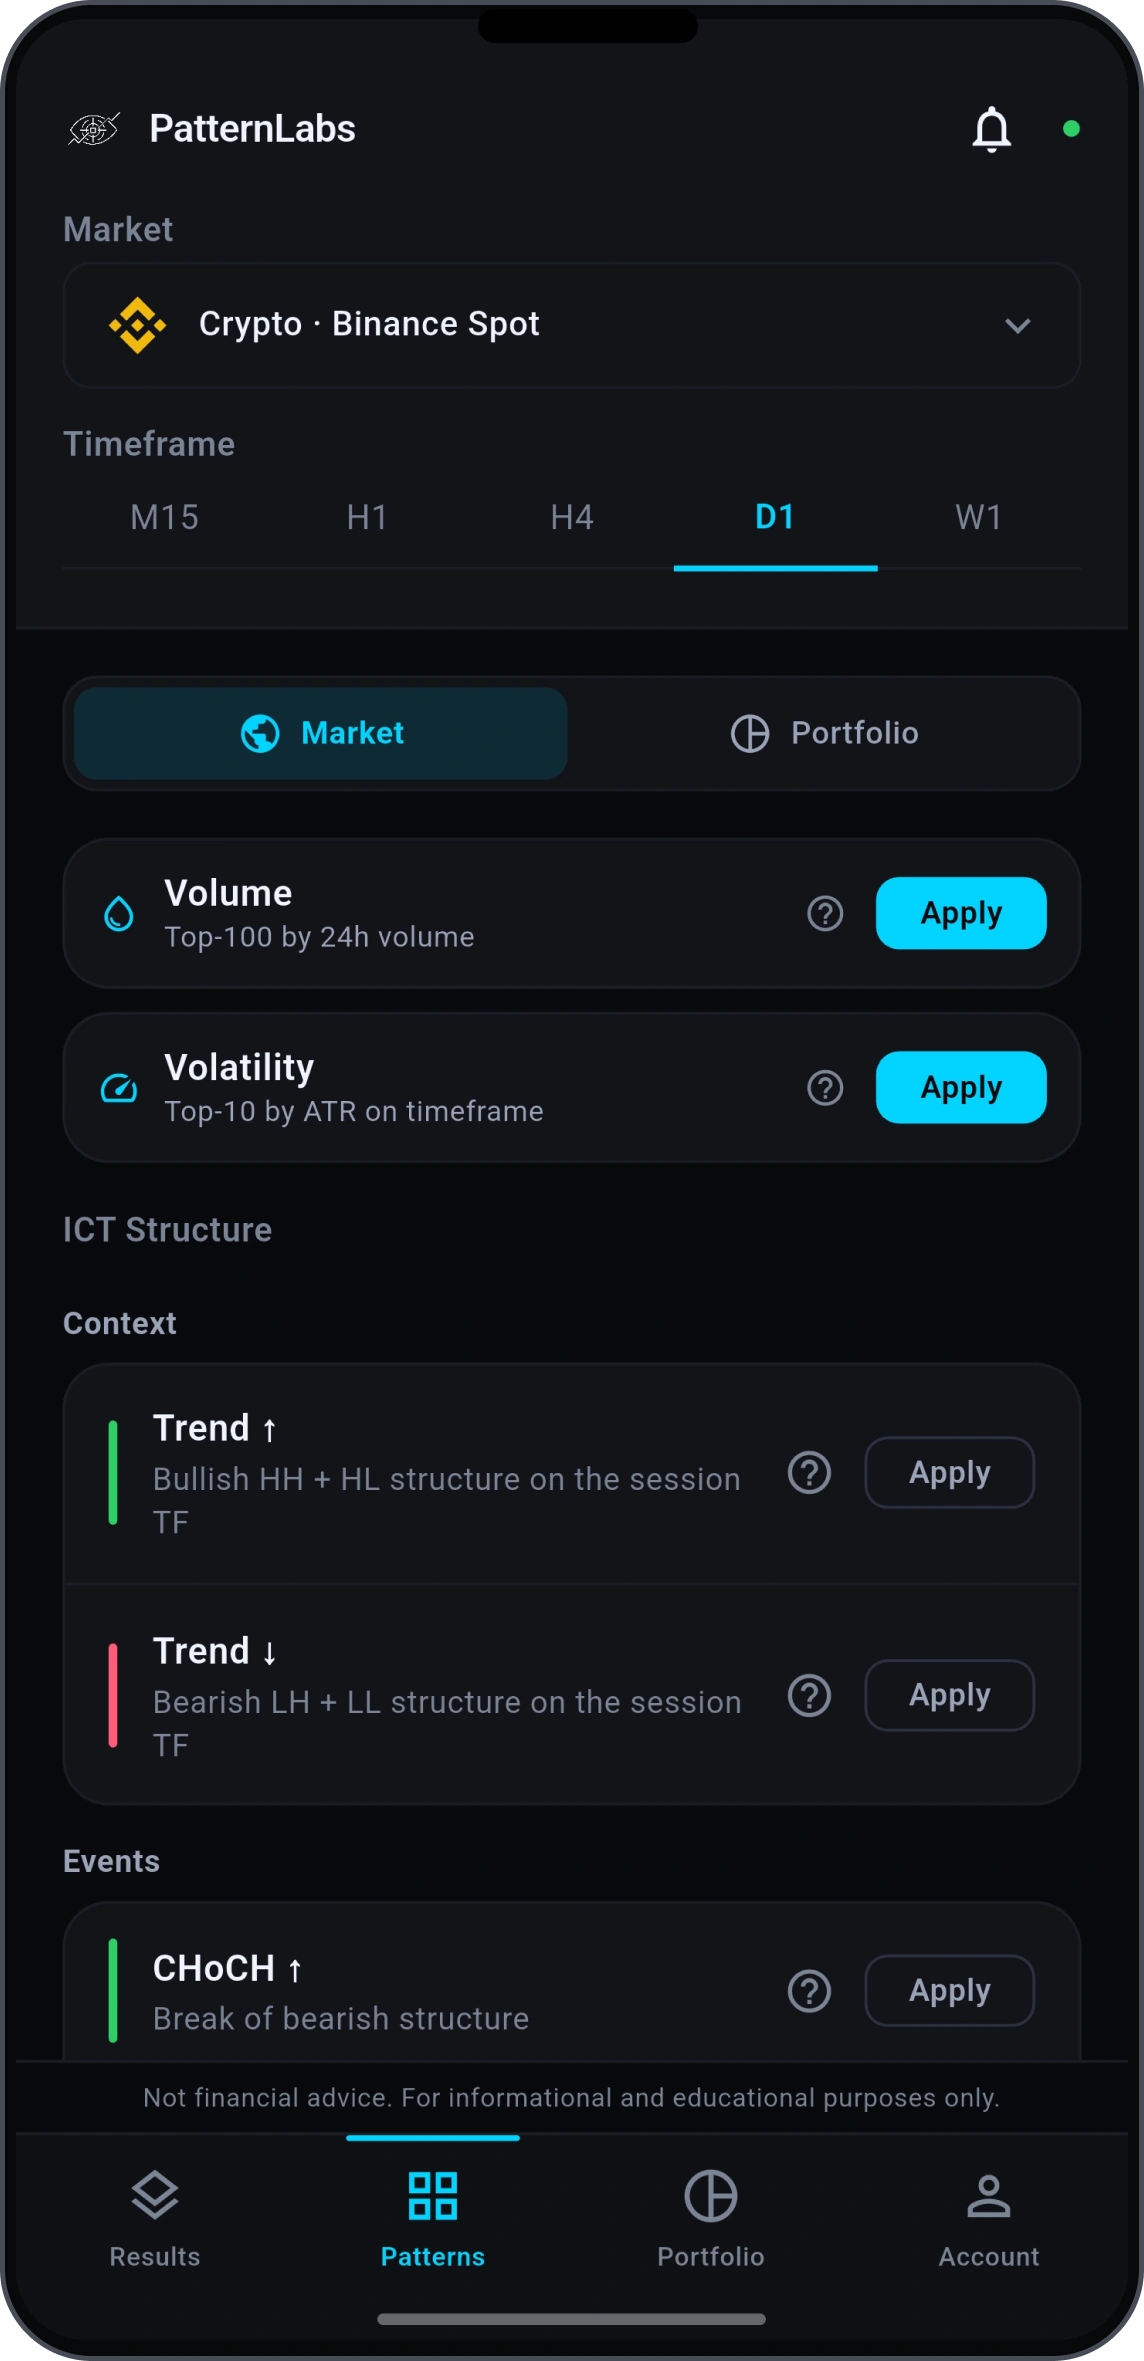
01 / SELECT THE MARKET
START WITH THE MARKET YOU WANT.
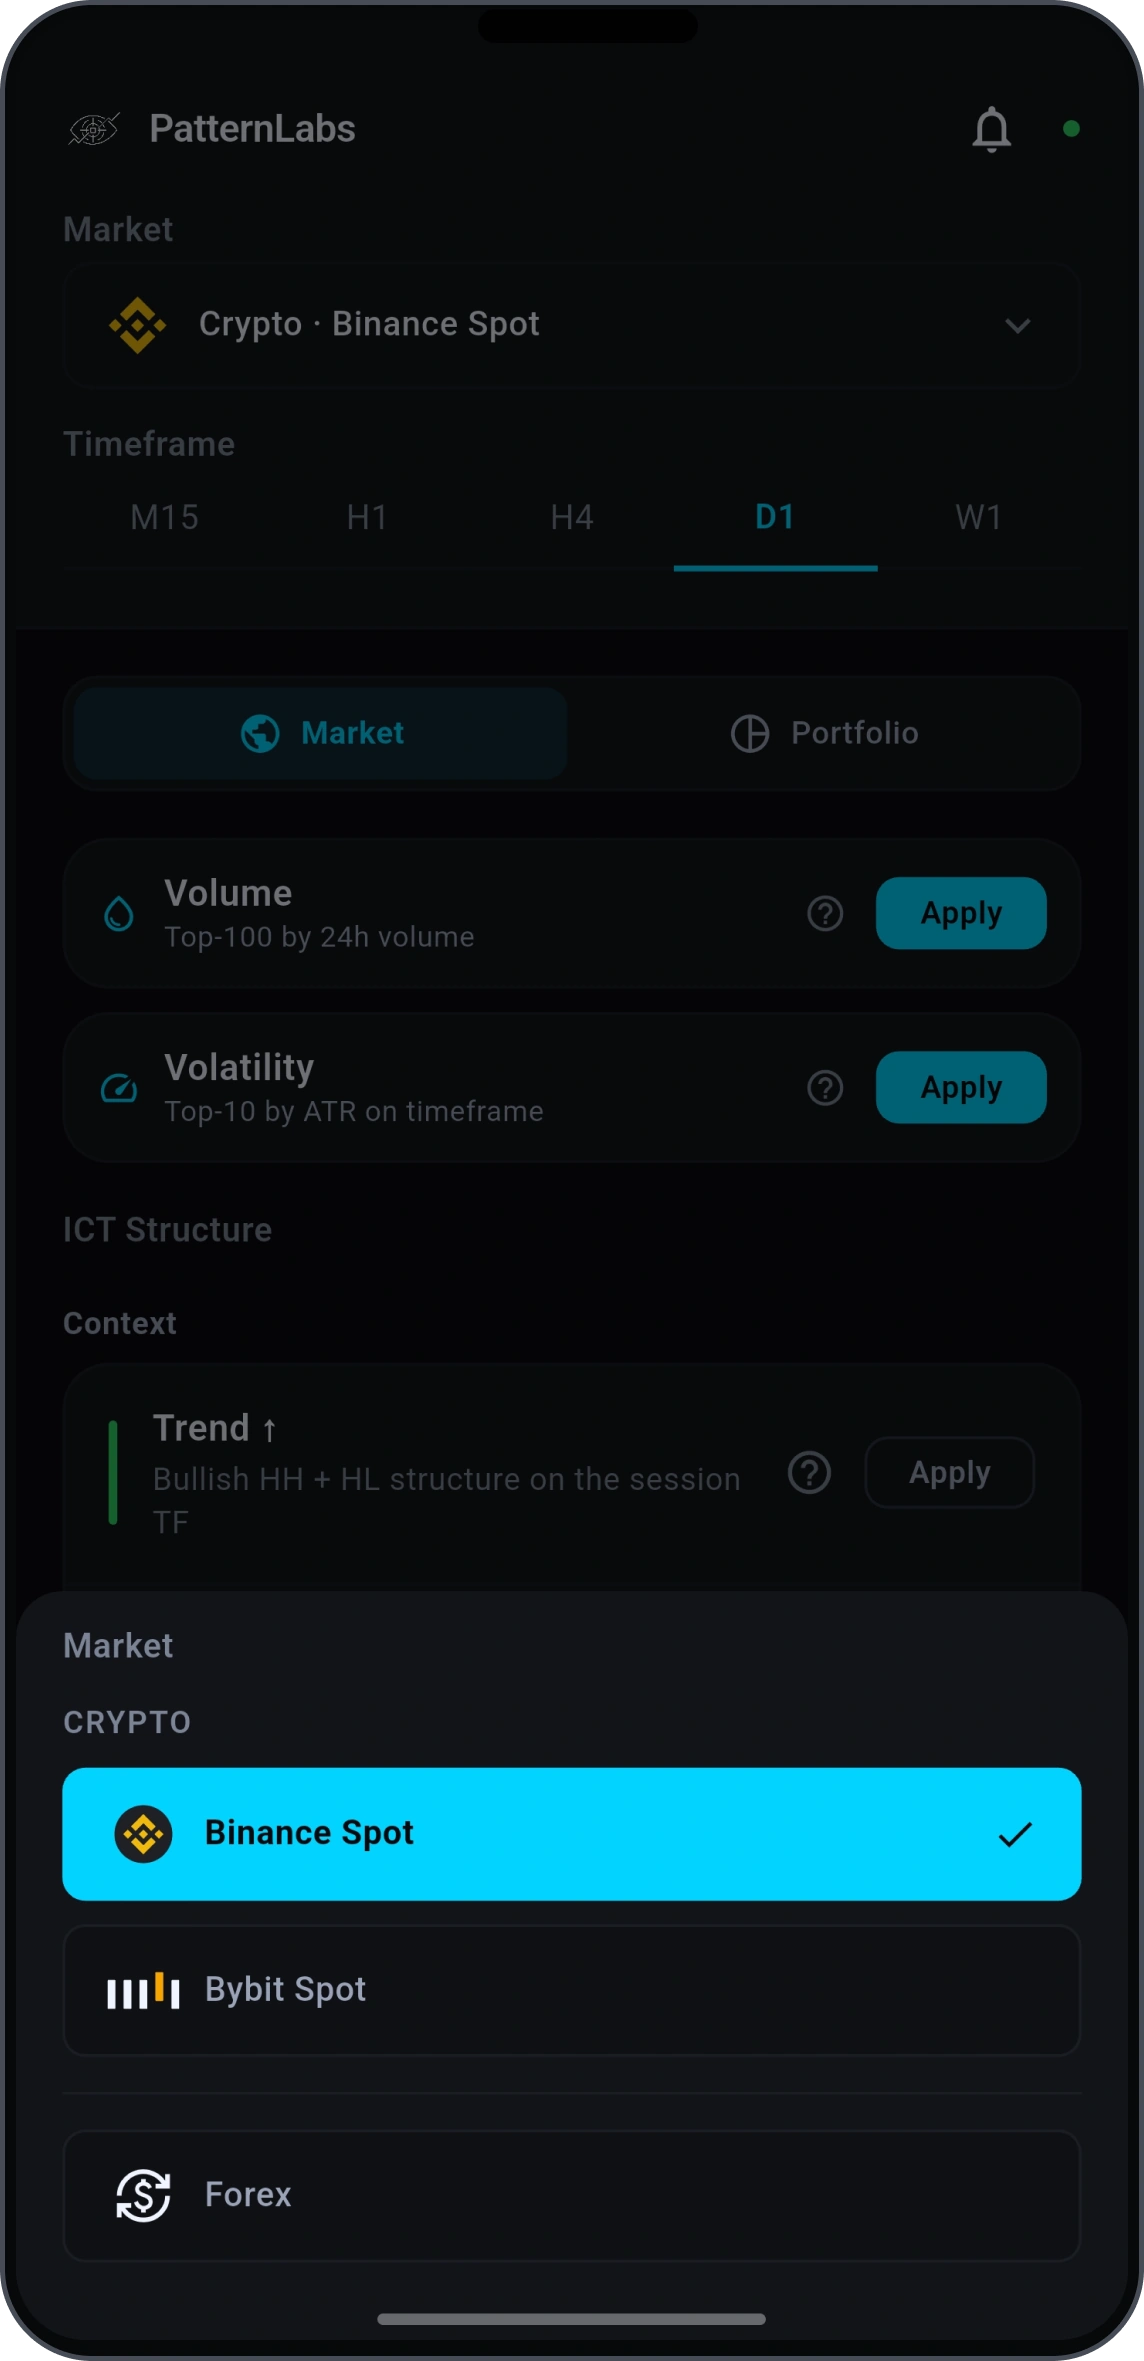
Choose where you want to scan. The Market selector keeps each scan focused on the pairs available in that market.
 PatternLabs®


TWO WAYS TO SCAN
Scan 600+ crypto and forex pairs with your own filter chains, or build a Portfolio of the pairs you care about and let PatternLabs analyze only them.
01 / THE MARKET UNIVERSE
ILLUSTRATIVE EXAMPLE · NOT LIVE RESULTSFILTERS
Start with 600+ trading pairs. Illustrative example, not live results.
02THE SCANNER
Choose a market, build a multi-timeframe filter chain, and explore every match in context.
01 / SELECT THE MARKET
Choose where you want to scan. The Market selector keeps each scan focused on the pairs available in that market.
02 / BUILD THE FILTER CHAIN
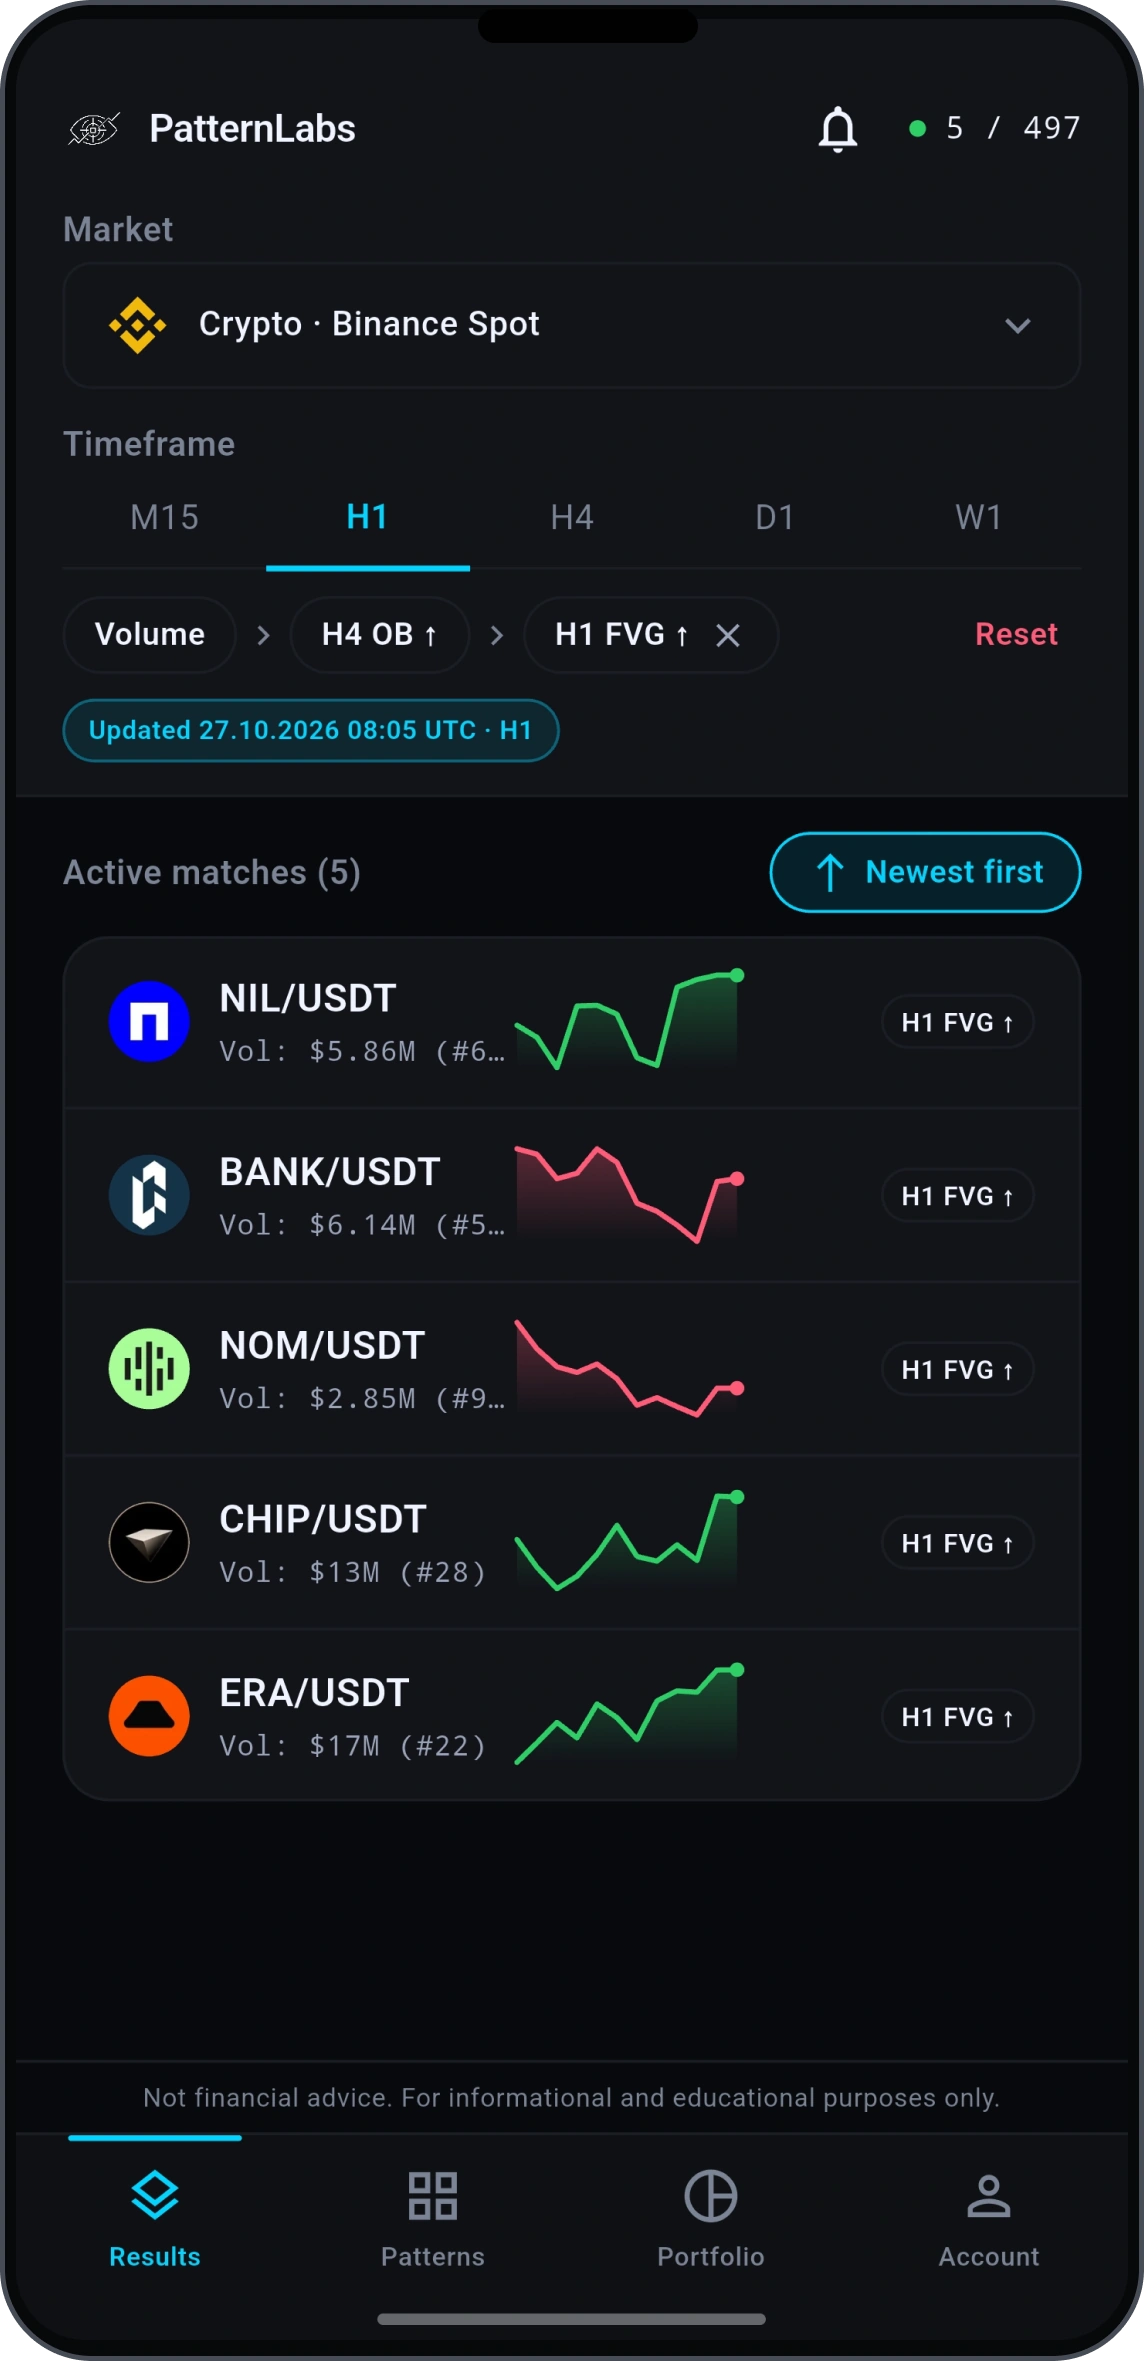
Start with Volume, then add a bullish Order Block on H4 and a bullish Fair Value Gap on H1. Each timeframe-based filter keeps its own timeframe.
03 / VIEW RESULTS
The pinned results bar keeps the number of matches in view. Open Results to compare volume, volume rank, mini charts and matched patterns, sorted by recency.
04 / EXPLORE THE CHART
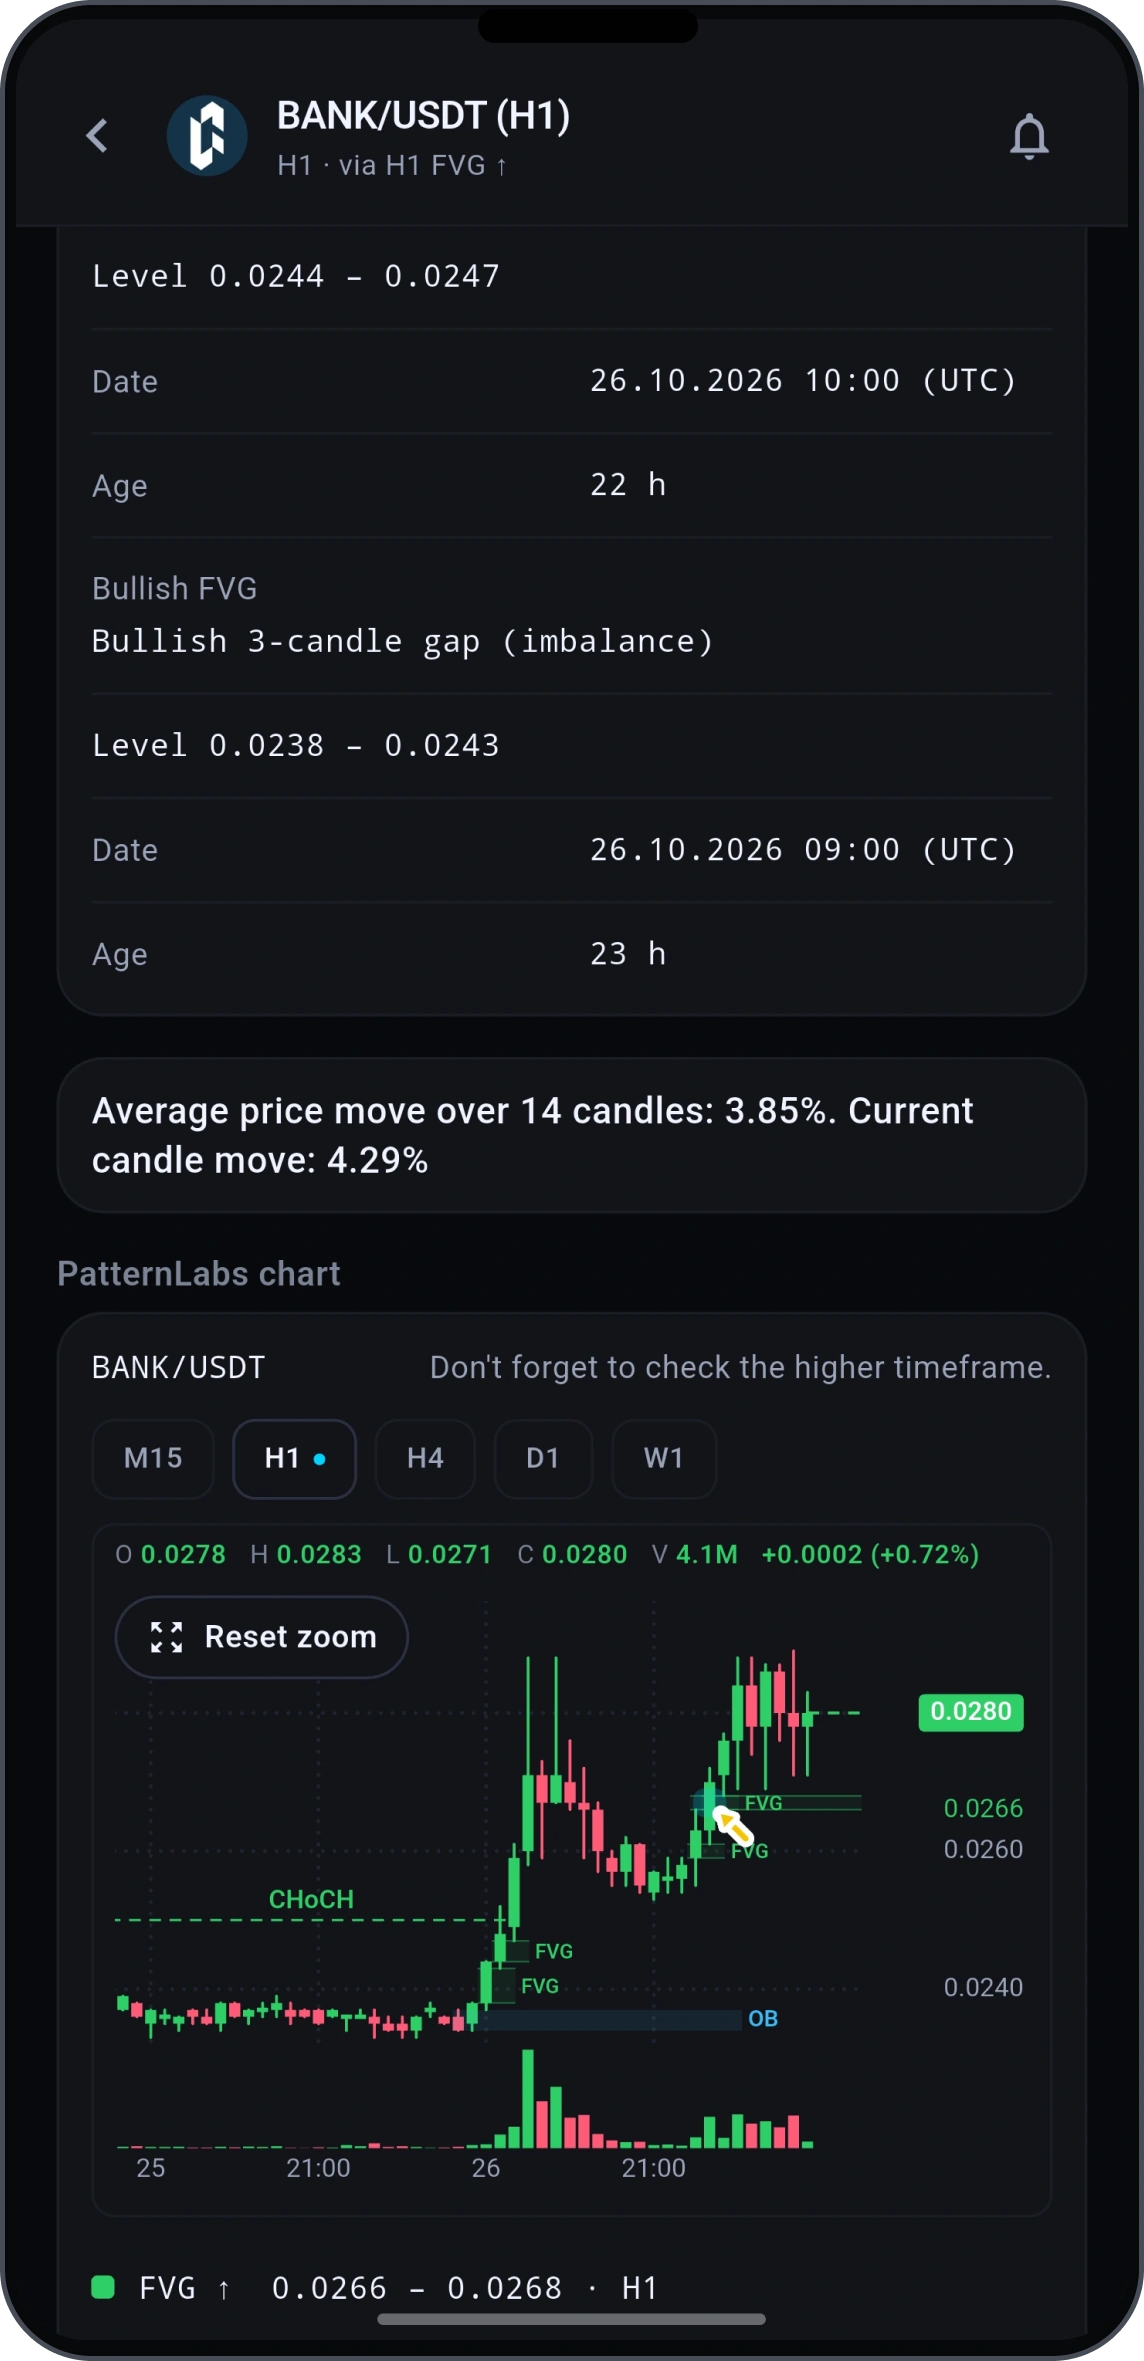
Open any result to inspect the pattern level, date and age, compare its average move with the current candle, and explore it on PatternLabs’ interactive chart. Switch timeframes, zoom, reset the view, save the pair or create an alert.
05 / FOLLOW YOUR PORTFOLIO
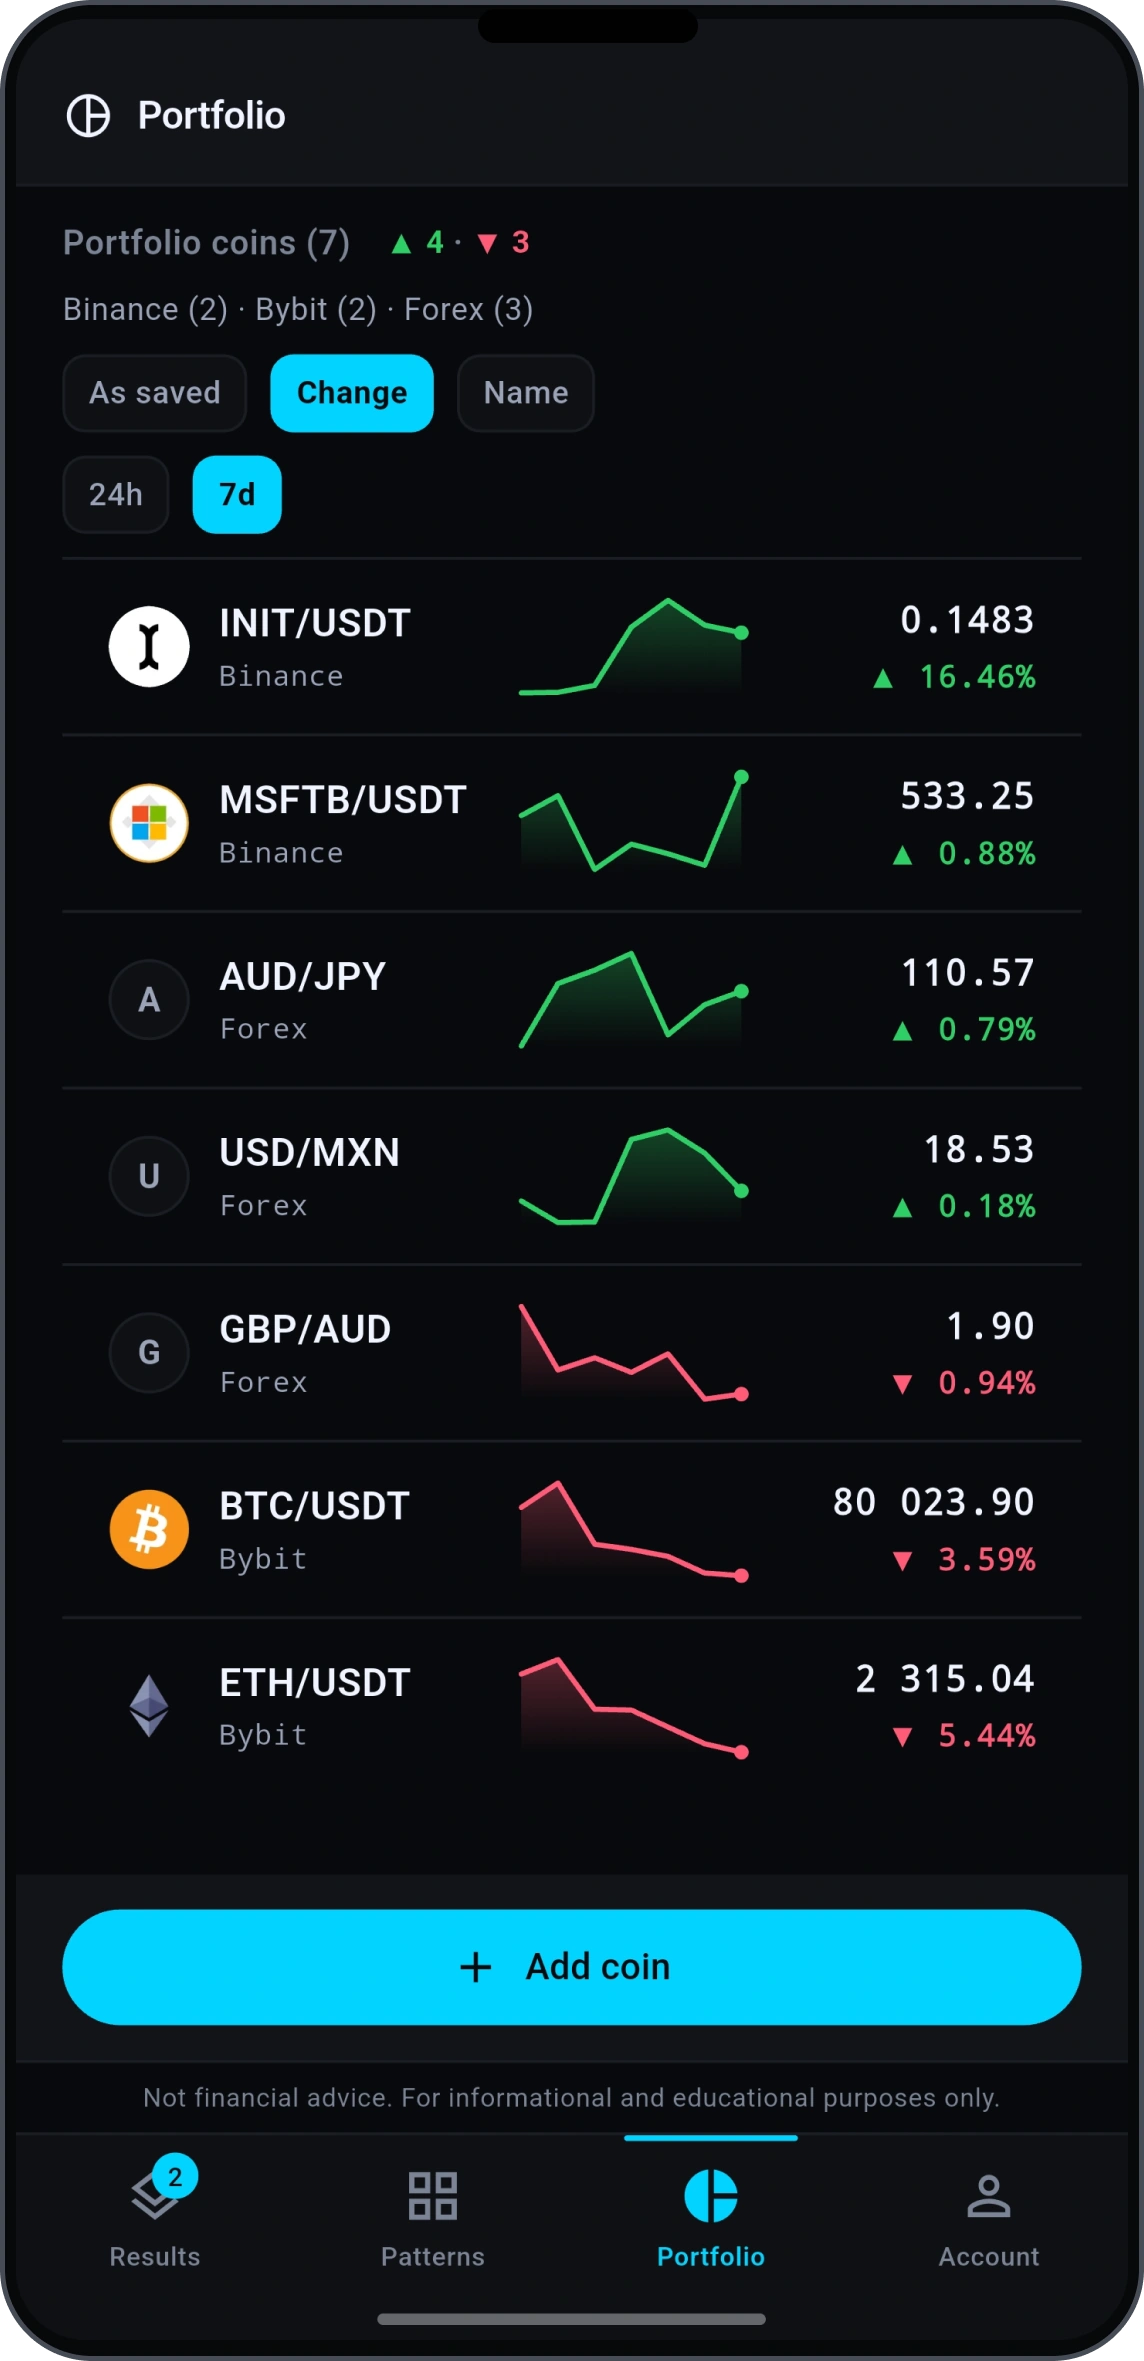
Build a Portfolio of the pairs you care about. Patterns and Results then work only with your list — crypto and forex side by side.
03PORTFOLIO
Choose the pairs you actually follow. Patterns and Results then work only with your list.
Guests: 5 pairs. Account: up to 10.
04MARKET SCAN VS PORTFOLIO
Use one or both. Same filters, same chart, different scope.
05NOTIFICATIONS
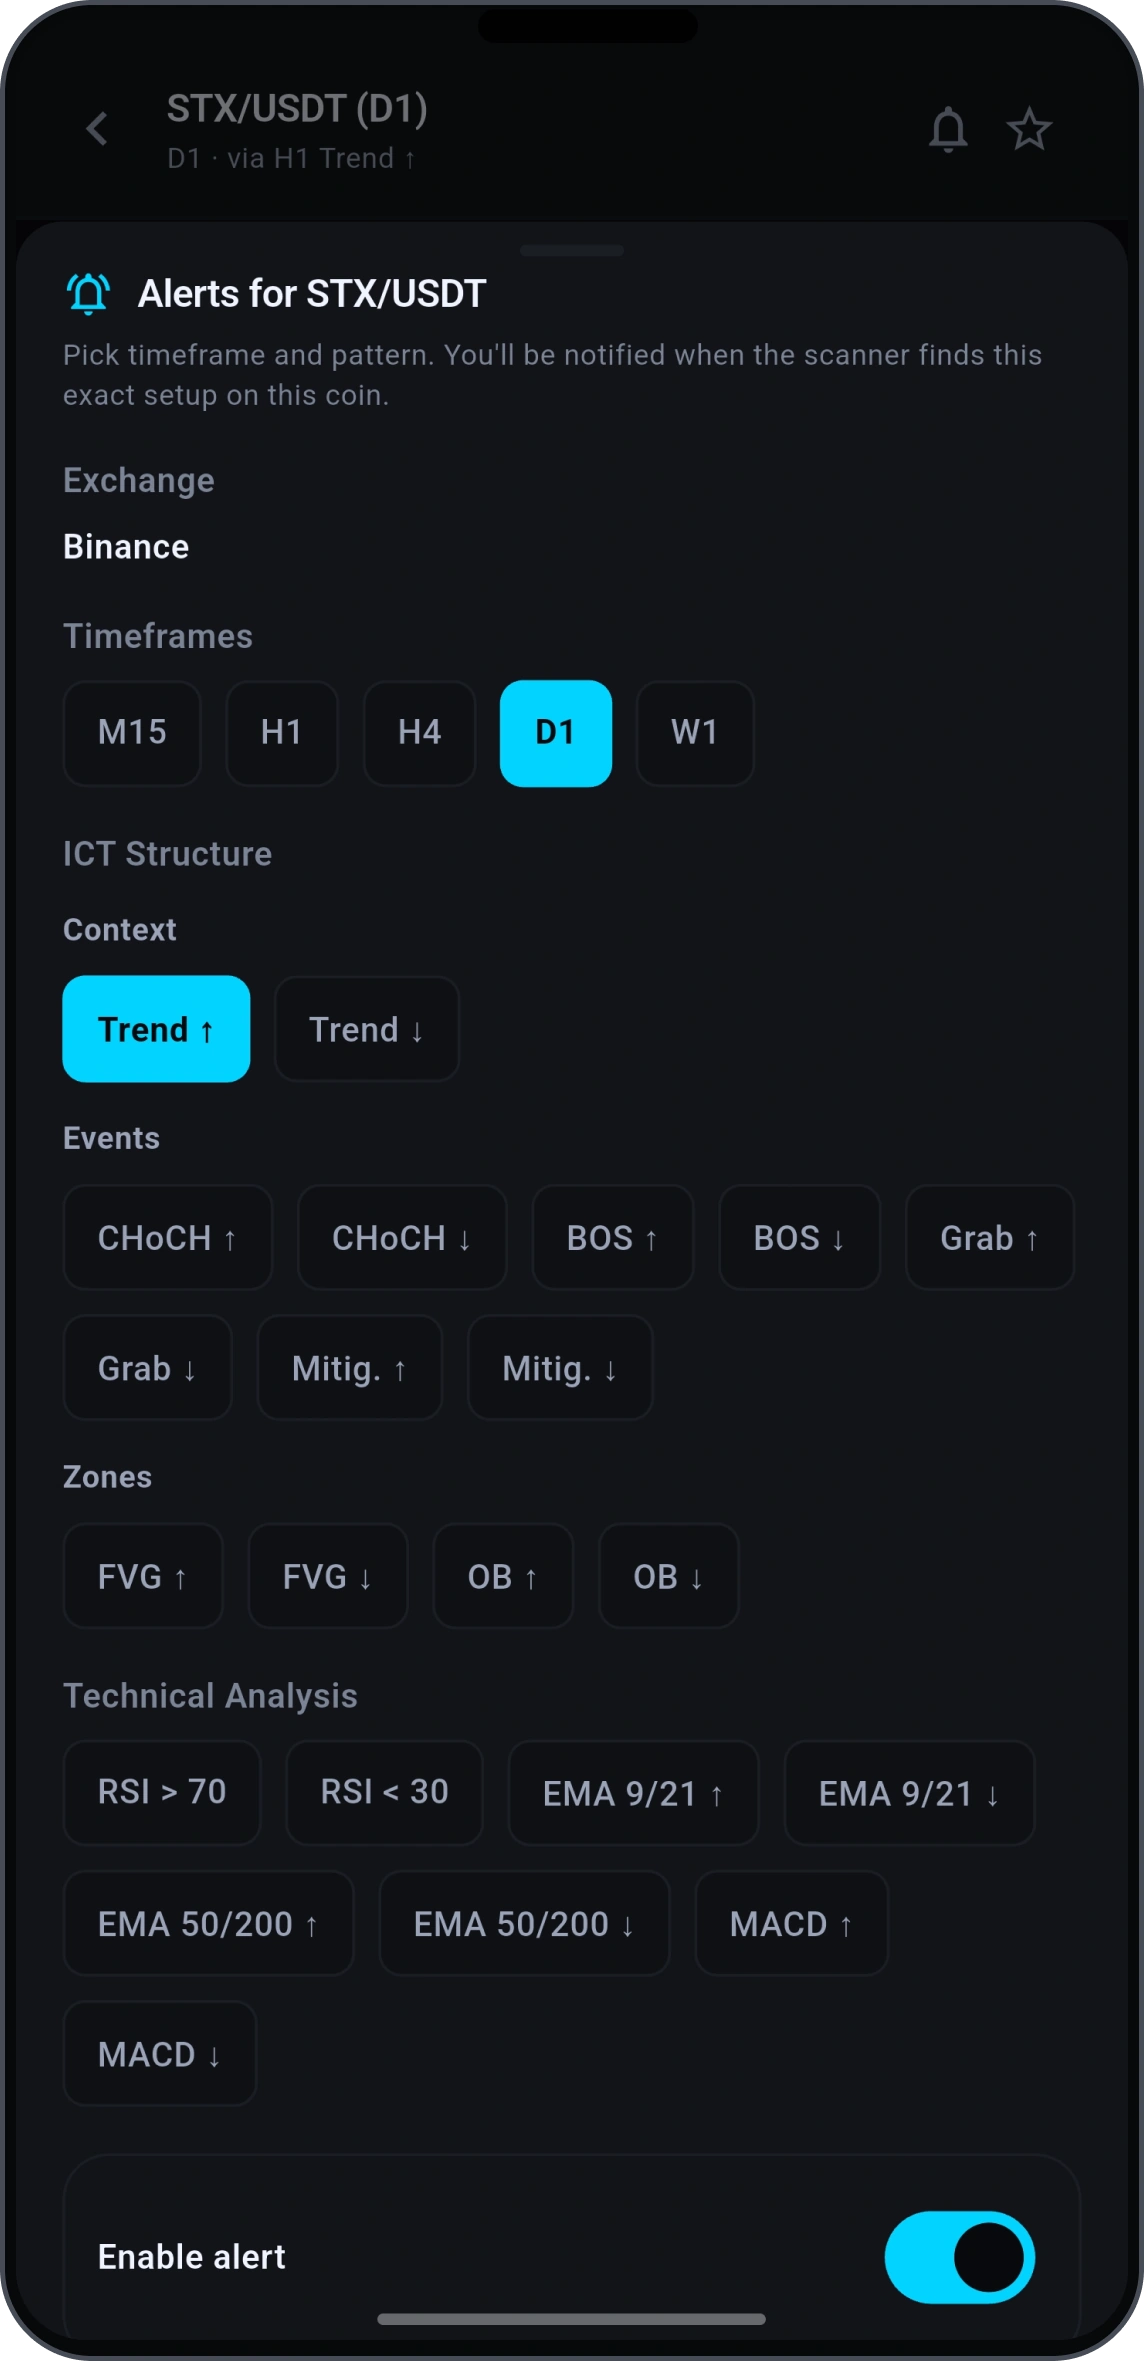
Keep your filter chains and set notifications by pair, pattern and timeframe — so you can review matches to your filters without starting over.
06EXAMPLES OF AVAILABLE FILTERS
Explore 20+ filters across market structure, liquidity, volume, price action and technical indicators — with more added over time.
The library keeps growing. These are selected examples, not the full catalog.
A close above a confirmed swing high continues the bullish structure. The broken level is highlighted.
After lower highs and lower lows, price closes above the last lower high — a bullish change of character.
A strong middle candle leaves a gap between the first candle’s high and the third candle’s low.
Price moves above a previous high, then closes back below it. The wick marks the liquidity sweep.
The RSI line drops below 30. The lower panel shows the threshold independently of the price chart.
The app selects the Top 100 by daily volume. This illustrative sample shows relative ranks with a normalized index (highest = 100), not raw units of different assets. The rows show an illustrative subset of the Top 100.
07WHY PATTERNLABS
Scan 600+ trading pairs without opening them one by one.
Combine multiple filters into one complete market setup.
Each timeframe-based filter can use its own timeframe.
Open any result and inspect the matched pattern directly on the interactive chart.
Set notifications by pair and pattern for the setups you want to review.
Build a Portfolio of your own pairs and analyze only them, without scanning the whole market.
08FAQ
PatternLabs currently covers 600+ unique trading pairs across supported crypto spot markets and forex. Pair availability may vary depending on the selected market and integration.
Portfolio is your personal list of pairs. Patterns and Results show matches only for these pairs, so you can follow specific instruments instead of the whole market.
20+ filters cover market structure, BOS, CHoCH, FVG, liquidity, order blocks, volume and technical indicators such as RSI. Combine filters into your own chain. The library continues to expand.
Guests can add up to 5 pairs. Registered users can add up to 10.
Yes. Build a filter chain that combines multiple patterns and scan for pairs that match the complete setup.
Yes. Pairs from Binance Spot, Bybit Spot and Forex can be in the same list.
Yes. Each timeframe-based filter can use its own timeframe. Volume selects the top 100 pairs by volume and does not use a timeframe.
They solve different tasks. Market Scan finds new setups across 600+ pairs. Portfolio keeps your analysis focused on the pairs you follow.
No. Scan and analyse markets without connecting an exchange account.
Yes. Create notifications by pair, pattern type and timeframe. They are enabled per account, only for what you turn on.
No. PatternLabs does not require your exchange API keys to use market scanning.
No. Portfolio does not store amounts, positions or exchange data. It is a list of the pairs you want PatternLabs to analyze.
Yes. Create an alert for a pair, pattern and supported timeframe. When conditions match your filters, PatternLabs can send a notification.
No. PatternLabs is a market scanner where you build your own pattern and filter chains. It surfaces matching pairs across the selected market instead of issuing predefined buy or sell calls.